Creating macros : Debugging macros
|
|
| Creating macros : Debugging macros |
To ensure that your macros run as expected, it’s important to debug them.
The Macro Editor provides four windows for debugging VBA code. The Macro Editor also provides two strong debugging facilities that are common to language editors: setting breakpoints, and stepping through code.
![]()
• |
The Macro Editor also supports two advanced debugging techniques that are not discussed in this
documentation: Making changes to the code while it is running, and watching and changing variables.
|
The Macro Editor provides four windows for debugging VBA code: the Call Stack window, the Immediate window, the Locals window, and the Watches window. All of these windows provide important information about the state of functions and variables while an application is running.
The Call Stack window is a modal dialog box that lists which function calls which function. In long, complicated applications, this information is useful for tracing the steps to a particular function being called. To visit a function listed in the window, select the function name and then click Show, or else close the window.
![]()
• |
To display the Call Stack window, click View } Call Stack.
|
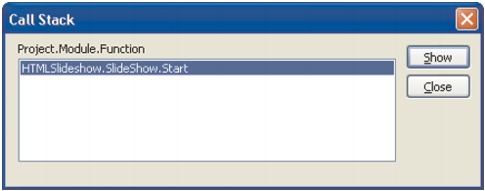
The Call Stack window
The Immediate window lets you type in and run arbitrary lines of code while a macro is paused. This functionality is useful for getting or setting the property of an object in the document, or for setting the value of a variable in the code. To run a piece of code, type it in the Immediate window, and then press Enter; the code is executed immediately.
![]()
• |
To display the Immediate window, click View } Immediate window.
|
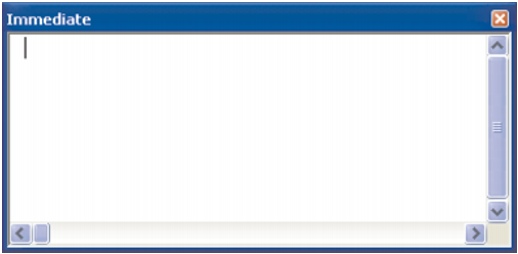
The Immediate window
The Locals window displays all variables and objects that exist within the current scope. The type and value for each variable are listed in the columns next to the name of the variable. Some variables and objects have several children, which can be displayed by clicking the button next to the parent. Many variables let you edit their value by clicking it.
![]()
• |
To display the Locals window, click View } Locals window.
|

The Locals window
The Watches window is used to watch specific variables or object properties. This functionality is useful for watching just one or two values rather than searching for them among all the values in the Locals window.
![]()
• |
To display the Watches window, click View } Watch window.
|
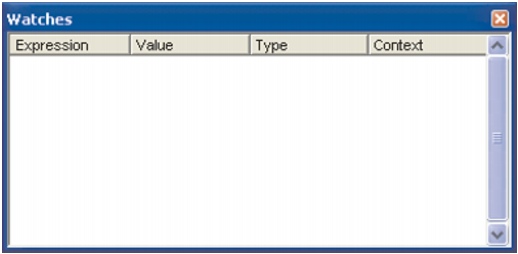
The Watches window
To add a value to the Watches window, do one of the following:
• |
Select the variable or object and its property, and then drag the selection onto the Watches window.
|
• |
Click the item, and then click Debug } Quick watch.
|
The Add Watch dialog appears.
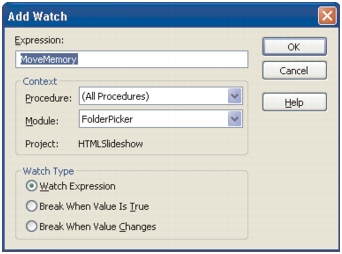
The Add Watch dialog box
Select the item that you want to watch, select any conditions for this watch, and then click OK. If the condition becomes true, the application pauses to let you examine the code.
A breakpoint is a marker in a line of code that causes execution to pause. To continue, you must either restart the execution or step through the subsequent lines of code.
To set or clear a breakpoint, click the line, and then click Debug } Toggle breakpoint. By default, the line is highlighted in dark red, and a red dot is placed in the margin.
To restart the code after it pauses at a breakpoint, click Run } Continue. To pause the execution of the code (immediately exiting from all functions and discarding all return values), click Run } Reset.
You can also “run to cursor” — that is, execute the code until it reaches the line that the cursor is on, and then pause at that line. To do this, click the line where you want execution to pause, and then click Debug } Run to cursor.
To clear all breakpoints, click Debug } Clear all breakpoints.
![]()
• |
If the line with the breakpoint (or the cursor, when “running to cursor”) is not executed because it is in a
conditional (if-then-else) block, the code does not stop at that line.
|
• |
Breakpoints are not saved. They are lost when you close the Macro Editor.
|
When execution pauses at a breakpoint, you can continue through the code one line at a time. This functionality, called “stepping through the code,” lets you do the following:
• |
examine the values of individual variables after each line
|
• |
determine how the code affects the values
|
• |
determine how the values affect the code
|
To step through the code, click Debug } Step into. The execution advances to every line in all called functions and subroutines.
To step through each line of the current function or subroutine but not through the lines of each called function or subroutine, click Debug } Step over. The called functions and subroutines are executed, but not line-by-line.
To execute the rest of the current function or subroutine but pause when the function or subroutine returns to the point where it was called, click Debug } Step out. This technique is a quick way of returning to the point of entry of a function, to continue stepping through the code of the calling function.
|
|
|
|
Copyright 2013 Corel Corporation. All rights reserved.